아래는 제가 요청하신 테이블을 Markdown 형식으로 변경한 것입니다.
| Header One | Header Two |
|---|---|
| Content One | Content Two |
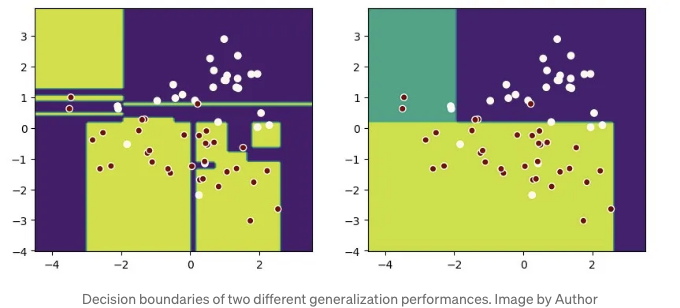
이 그래프를 보면 동일한 데이터 세트에서 오른쪽 모델이 더 일반화하는 데 더 좋다는 것을 알 수 있습니다.
대부분의 머신러닝 서적은 시각화에 대해 matplotlib 코드를 사용하기를 선호합니다. 이는 다음과 같은 문제를 야기합니다:
- Matplotlib로 그리기에 대해 많은 내용을 배워야 합니다.
- 플로팅 코드가 노트북을 가득 채우므로 읽기 어려워집니다.
- 때로는 비즈니스 환경에서 이상적이지 않은 타사 라이브러리가 필요할 수 있습니다.
좋은 소식이에요! Scikit-learn은 이제 Display 클래스를 제공하며 from_estimator 및 from_predictions과 같은 메소드를 사용하여 다양한 상황에서 그래프를 그리기가 훨씬 쉬워졌어요.
궁금하신가요? 이 멋진 API를 보여드릴게요.
Scikit-learn Display API 소개
사용 가능한 API를 찾으려면 utils.discovery.all_displays를 사용하세요
Scikit-learn (sklearn)은 항상 새 릴리스에서 Display API를 추가하기 때문에 당신의 버전에서 무엇을 사용할 수 있는지 알아두는 것이 중요합니다.
Sklearn의 utils.discovery.all_displays를 사용하면 사용할 수 있는 클래스들을 볼 수 있습니다.
from sklearn.utils.discovery import all_displays

displays = all_displays()
displays
예를 들어, 내 Scikit-learn 1.4.0에서 이러한 클래스들을 사용할 수 있습니다:
[
  ("CalibrationDisplay", sklearn.calibration.CalibrationDisplay),
  ("ConfusionMatrixDisplay", sklearn.metrics._plot.confusion_matrix.ConfusionMatrixDisplay),
  ("DecisionBoundaryDisplay", sklearn.inspection._plot.decision_boundary.DecisionBoundaryDisplay),
  ("DetCurveDisplay", sklearn.metrics._plot.det_curve.DetCurveDisplay),
  ("LearningCurveDisplay", sklearn.model_selection._plot.LearningCurveDisplay),
  ("PartialDependenceDisplay", sklearn.inspection._plot.partial_dependence.PartialDependenceDisplay),
  ("PrecisionRecallDisplay", sklearn.metrics._plot.precision_recall_curve.PrecisionRecallDisplay),
  ("PredictionErrorDisplay", sklearn.metrics._plot.regression.PredictionErrorDisplay),
  ("RocCurveDisplay", sklearn.metrics._plot.roc_curve.RocCurveDisplay),
  ("ValidationCurveDisplay", sklearn.model_selection._plot.ValidationCurveDisplay),
];
decision_boundaries를 위해 inspection.DecisionBoundaryDisplay 사용하기
decision boundaries로 시작해보죠.
matplotlib를 사용하여 draw 하는 경우, 번거롭습니다.
- np.linspace을 사용하여 좌표 범위 설정;
- plt.meshgrid를 사용하여 그리드 계산;
- plt.contourf를 사용하여 결정 경계를 채우기;
- 그런 다음 plt.scatter를 사용하여 데이터 포인트를 플로팅합니다.
이제 inspection.DecisionBoundaryDisplay를 사용하여이 프로세스를 간소화 할 수 있습니다:
from sklearn.inspection import DecisionBoundaryDisplay
from sklearn.datasets import load_iris
from sklearn.svm import SVC
from sklearn.pipeline import make_pipeline
from sklearn.preprocessing import StandardScaler
import matplotlib.pyplot as plt

iris = load_iris(as_frame=True)
X = iris.data[['petal length (cm)', 'petal width (cm)']]
y = iris.target


svc_clf = make_pipeline(StandardScaler(),
                        SVC(kernel='linear', C=1))
svc_clf.fit(X, y)

display = DecisionBoundaryDisplay.from_estimator(svc_clf, X,
                                                 grid_resolution=1000,
                                                 xlabel="Petal length (cm)",
                                                 ylabel="Petal width (cm)")
plt.scatter(X.iloc[:, 0], X.iloc[:, 1], c=y, edgecolors='w')
plt.title("Decision Boundary")
plt.show()
이 그림에서 최종 효과를 확인하십시오:
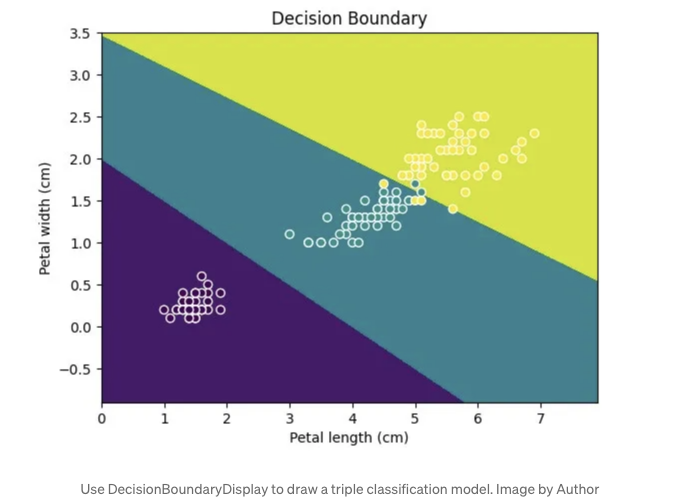
기억해 주세요. Display 기능은 2D만 그릴 수 있으므로 데이터가 두 개의 특성 또는 축소된 차원만 가지고 있는지 확인하세요.
확률 보정을 위해 calibration.CalibrationDisplay 사용
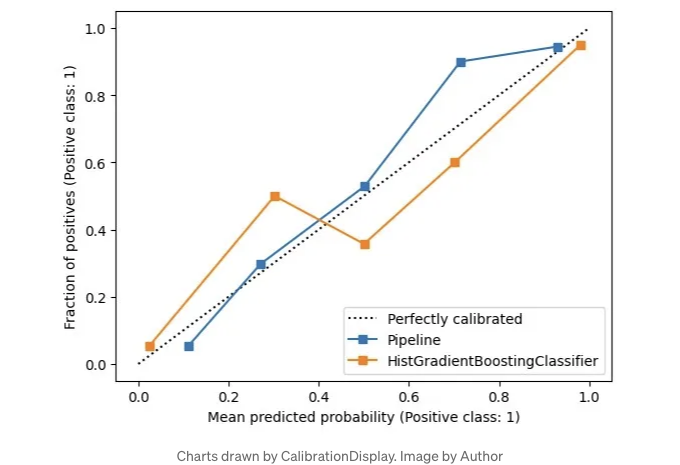
분류 모델을 비교하기 위해 확률 보정 곡선은 모델이 예측에 자신감을 가지고 있는지를 보여줍니다.
CalibrationDisplay는 모델의 predict_proba를 사용합니다. Support Vector Machine을 사용하는 경우 확률을 True로 설정해주세요:
from sklearn.calibration import CalibrationDisplay
from sklearn.model_selection import train_test_split
from sklearn.datasets import make_classification
from sklearn.ensemble import HistGradientBoostingClassifier

X, y = make_classification(n_samples=1000,
                           n_classes=2, n_features=5,
                           random_state=42)
X_train, X_test, y_train, y_test = train_test_split(X, y,
                                            test_size=0.3, random_state=42)
proba_clf = make_pipeline(StandardScaler(),
                          SVC(kernel="rbf", gamma="auto",
                              C=10, probability=True))
proba_clf.fit(X_train, y_train)

CalibrationDisplay.from_estimator(proba_clf,
                                            X_test, y_test)

hist_clf = HistGradientBoostingClassifier()
hist_clf.fit(X_train, y_train)

ax = plt.gca()
CalibrationDisplay.from_estimator(hist_clf,
                                  X_test, y_test,
                                  ax=ax)
plt.show()
혼동 행렬에 대한 metrics.ConfusionMatrixDisplay 사용하기
분류 모델을 평가하고 불균형 데이터를 다룰 때, 우리는 정밀도와 재현율을 살펴봅니다.
이들은 TP, FP, TN, FN으로 나뉘며, 혼동 행렬을 구성합니다.
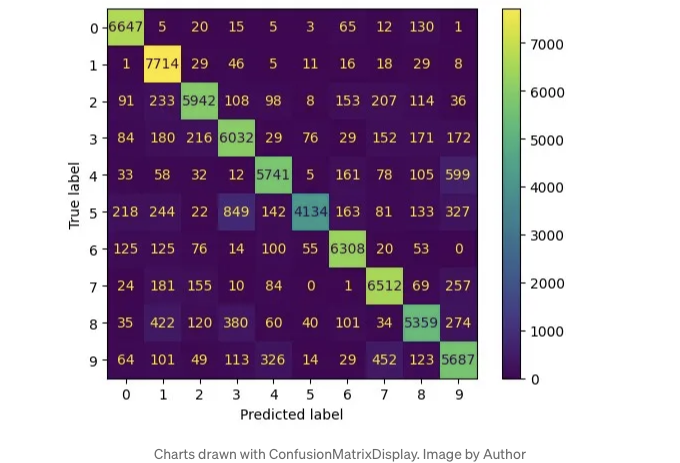
혼동 행렬을 그리려면 metrics.ConfusionMatrixDisplay를 사용하세요. 이렇게 그림을 그릴 수 있고요, 이미 잘 알려져 있어서 자세하게 설명은 생략할게요.
from sklearn.datasets import fetch_openml
from sklearn.ensemble import RandomForestClassifier
from sklearn.metrics import ConfusionMatrixDisplay

digits = fetch_openml('mnist_784', version=1)
X, y = digits.data, digits.target
rf_clf = RandomForestClassifier(max_depth=5, random_state=42)
rf_clf.fit(X, y)

ConfusionMatrixDisplay.from_estimator(rf_clf, X, y)
plt.show()
아래는 이미지 링크입니다:
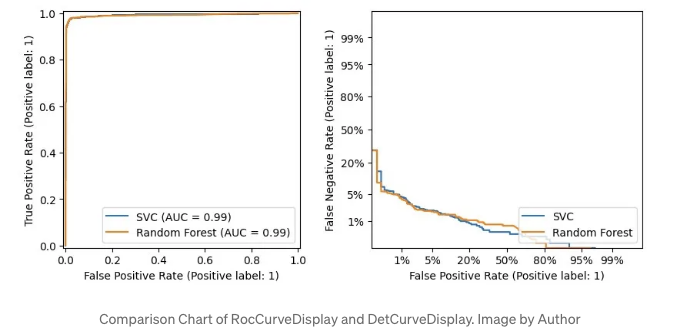
metrics.RocCurveDisplay 및 metrics.DetCurveDisplay
이 두 가지가 함께 소개되는 이유는 종종 측정할 때 함께 사용하기 때문입니다.
RocCurveDisplay는 모델의 TPR 및 FPR을 비교합니다.
이진 분류의 경우, 낮은 FPR과 높은 TPR을 원하기 때문에 좌상단이 가장 좋습니다. Roc 곡선은 이 쪽으로 휘어집니다.
Roc 곡선이 좌상단에 근접하여 유지되기 때문에 우하단이 비어 있는데, 이는 모델 간 차이를 파악하기 어렵게 만듭니다.
그래서 우리는 또한 FNR과 FPR로 Det 곡선을 그리는 DetCurveDisplay를 사용합니다. 이는 Roc 곡선보다 명확하게 만들어주는 데 더 많은 공간을 사용합니다.
Det 곡선의 완벽한 지점은 좌하단입니다.
from sklearn.metrics import RocCurveDisplay
from sklearn.metrics import DetCurveDisplay

X, y = make_classification(n_samples=10_000, n_features=5,
                           n_classes=2, n_informative=2)
X_train, X_test, y_train, y_test = train_test_split(X, y,
                                             test_size=0.3, random_state=42,
                                                   stratify=y)


classifiers = {
    "SVC": make_pipeline(StandardScaler(),
                        SVC(kernel="linear", C=0.1, random_state=42)),
    "Random Forest": RandomForestClassifier(max_depth=5, random_state=42)
}

fig, [ax_roc, ax_det] = plt.subplots(1, 2, figsize=(10, 4))
for name, clf in classifiers.items():
    clf.fit(X_train, y_train)

    RocCurveDisplay.from_estimator(clf, X_test, y_test, ax=ax_roc, name=name)
    DetCurveDisplay.from_estimator(clf, X_test, y_test, ax=ax_det, name=name)
Using metrics.PrecisionRecallDisplay to adjust thresholds
With imbalanced data, you might want to shift recall and precision.
- 이메일 사기를 방지하려면 고정도가 필요합니다.
- 질병 선별을 위해서는 더 많은 사례를 포착하기 위해 고회수가 필요합니다.
임계값을 조정할 수 있지만, 적절한 양이 무엇인지 궁금하신가요?
여기서 metrics.PrecisionRecallDisplay가 도움이 될 수 있습니다.
from xgboost import XGBClassifier
from sklearn.datasets import load_wine
from sklearn.metrics import PrecisionRecallDisplay

wine = load_wine()
X, y = wine.data[wine.target<=1], wine.target[wine.target<=1]
X_train, X_test, y_train, y_test = train_test_split(X, y, test_size=0.3, stratify=y, random_state=42)

xgb_clf = XGBClassifier()
xgb_clf.fit(X_train, y_train)

PrecisionRecallDisplay.from_estimator(xgb_clf, X_test, y_test)
plt.show()
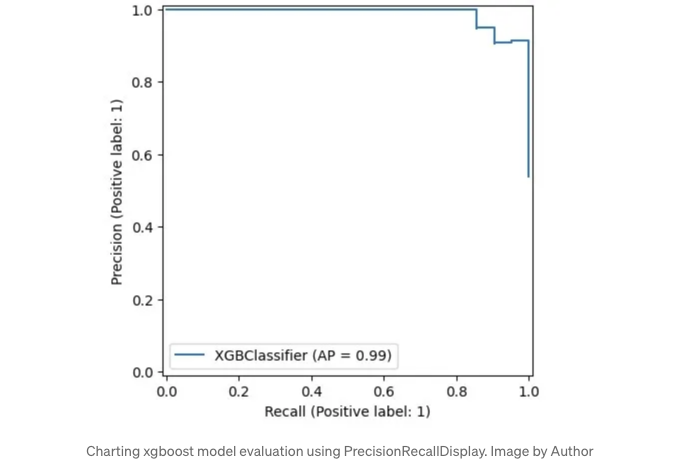
Scikit-learn의 디자인을 따르는 모델은 여기처럼 그릴 수 있습니다. 편리하죠?
회귀 모델에 metrics.PredictionErrorDisplay 사용하기
우리는 분류에 대해 이야기했었는데, 이제 회귀에 대해 이야기해볼게요.
사이킷런의 metrics.PredictionErrorDisplay는 회귀 모델을 평가하는 데 도움이 됩니다.
from sklearn.svm import SVR
from sklearn.metrics import PredictionErrorDisplay

rng = np.random.default_rng(42)
X = rng.random(size=(200, 2)) * 10
y = X[:, 0]**2 + 5 * X[:, 1] + 10 + rng.normal(loc=0.0, scale=0.1, size=(200,))

reg = make_pipeline(StandardScaler(), SVR(kernel='linear', C=10))
reg.fit(X, y)

fig, axes = plt.subplots(1, 2, figsize=(8, 4))
PredictionErrorDisplay.from_estimator(reg, X, y, ax=axes[0], kind="actual_vs_predicted")
PredictionErrorDisplay.from_estimator(reg, X, y, ax=axes[1], kind="residual_vs_predicted")
plt.show()
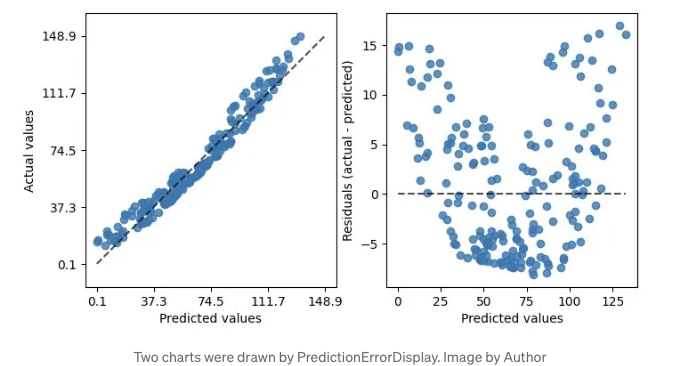
그림에서와 같이 두 종류의 그래프를 그릴 수 있습니다. 왼쪽 그래프는 예측 대 실제 값 비교를 보여주며, 선형 회귀 분석에 적합합니다.
하지만 모든 데이터가 완벽하게 선형적이지는 않습니다. 그럴 때는 적절한 그래프를 사용하세요.
실제 대 예측 차이인 잔차 도표를 그려보세요.
이 도표의 바나나 모양은 데이터가 선형 회귀에 맞지 않을 수 있다는 것을 시사합니다.
선형에서 rbf 커널로 전환하는 것이 도움이 될 수 있습니다.
reg = make_pipeline(StandardScaler(), SVR((kernel = "rbf"), (C = 10)));
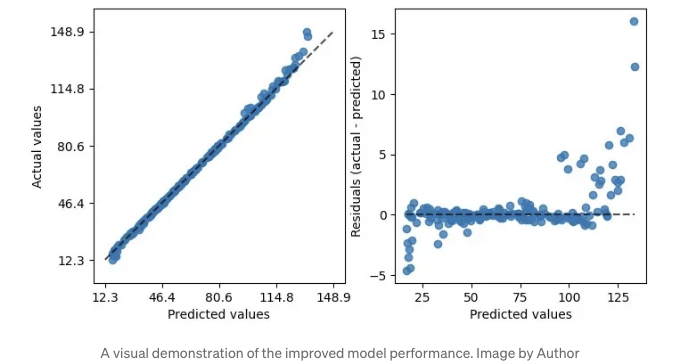
이렇게 rbf를 사용하면 잔차 플롯이 더 나아 보여요.
학습 곡선에 model_selection.LearningCurveDisplay 사용하기
성능을 평가한 후 LearningCurveDisplay를 사용하여 최적화를 살펴봅시다.
첫 번째로, 학습 곡선을 확인해봅시다. 이 모델이 다양한 학습 및 테스트 데이터로 얼마나 일반화되며, 과적합 또는 편향 문제가 있는지 살펴봅니다.
아래에서는 DecisionTreeClassifier와 GradientBoostingClassifier를 비교하여 학습 데이터가 변할 때 어떻게 작동하는지 살펴봅니다.
from sklearn.tree import DecisionTreeClassifier
from sklearn.ensemble import GradientBoostingClassifier
from sklearn.model_selection import LearningCurveDisplay

X, y = make_classification(n_samples=1000, n_classes=2, n_features=10,
                           n_informative=2, n_redundant=0, n_repeated=0)

tree_clf = DecisionTreeClassifier(max_depth=3, random_state=42)
gb_clf = GradientBoostingClassifier(n_estimators=50, max_depth=3, tol=1e-3)

train_sizes = np.linspace(0.4, 1.0, 10)
fig, axes = plt.subplots(1, 2, figsize=(10, 4))
LearningCurveDisplay.from_estimator(tree_clf, X, y,
                                    train_sizes=train_sizes,
                                    ax=axes[0],
                                    scoring='accuracy')
axes[0].set_title('DecisionTreeClassifier')
LearningCurveDisplay.from_estimator(gb_clf, X, y,
                                    train_sizes=train_sizes,
                                    ax=axes[1],
                                    scoring='accuracy')
axes[1].set_title('GradientBoostingClassifier')
plt.show()
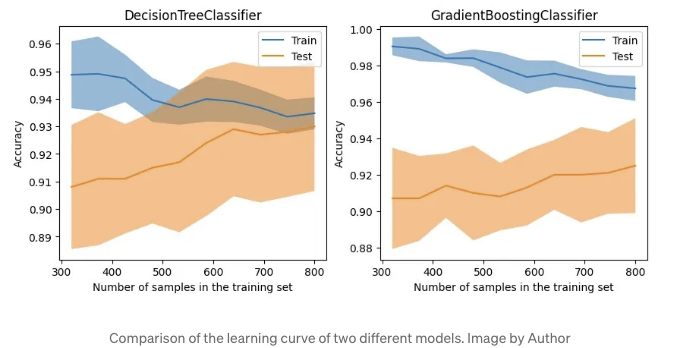
해당 그래프는 트리 기반 GradientBoostingClassifier가 훈련 데이터에서 높은 정확도를 유지하더라도, 테스트 데이터에서는 DecisionTreeClassifier와 비교하여 상당한 장점이 없다는 것을 보여줍니다.
매개변수 튜닝 시 시각화를 위해 model_selection.ValidationCurveDisplay 사용
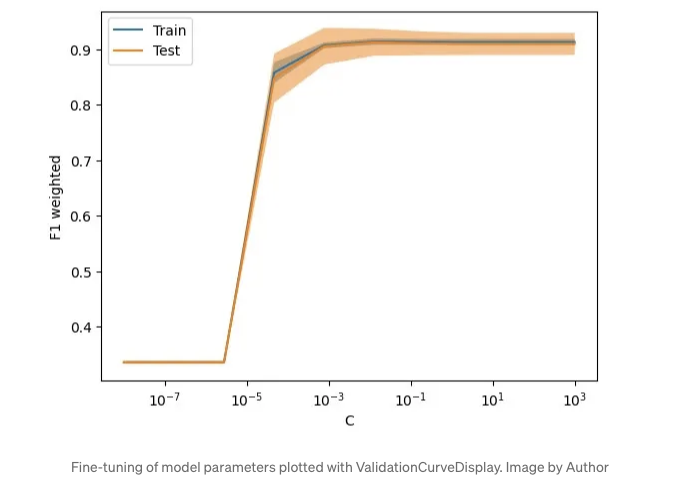
그러므로, 다른 부분에 대해 일반화되지 않는 모델의 경우, 모델의 정규화 매개변수를 조정하여 성능을 미세 조정해 볼 수 있습니다.
전통적인 방법은 GridSearchCV 또는 Optuna와 같은 도구를 사용하여 모델을 조정하는 것이었지만, 이러한 방법은 전반적으로 성능이 가장 좋은 모델만 제공하며 조정 과정이 그다지 직관적이지 않습니다.
특정 매개변수를 조정하여 모델의 영향을 테스트하고 싶은 시나리오의 경우, model_selection.ValidationCurveDisplay를 사용하여 매개변수가 변경됨에 따라 모델이 어떻게 수행되는지 시각화하는 것을 권장합니다.
from sklearn.model_selection import ValidationCurveDisplay
from sklearn.linear_model import LogisticRegression

param_name, param_range = "C", np.logspace(-8, 3, 10)
lr_clf = LogisticRegression()

ValidationCurveDisplay.from_estimator(lr_clf, X, y,
                                      param_name=param_name,
                                      param_range=param_range,
                                      scoring='f1_weighted',
                                      cv=5, n_jobs=-1)
plt.show()
아쉬운 점
이러한 표시물을 모두 시도해본 후 몇 가지 아쉬운 점을 인정해야 합니다:
- 가장 큰 아쉬움은 이러한 API의 대부분이 자세한 튜토리얼을 제공하지 않는다는 것입니다. 이것이 Scikit-learn의 철저한 문서와 비교되어 잘 알려지지 않은 이유일 것입니다.
- 이러한 API는 다양한 패키지에 흩어져 있어 한 곳에서 참조하기 어렵습니다.
- 코드는 여전히 매우 기본적입니다. 종종 Matplotlib의 API와 함께 사용하여 작업을 완료해야 합니다. 전형적인 예는 DecisionBoundaryDisplay인데, 결정 경계를 플로팅한 후에도 데이터 분포를 플로팅하기 위해 Matplotlib이 필요합니다.
- 확장하기 어렵습니다. 몇 가지 매개변수를 확인하는 메서드 외에 도구나 방법으로 내 모델 시각화 과정을 간단하게 하는 것은 힘듭니다. 많은 부분을 다시 작성해야 합니다.
이러한 API들이 더 많은 관심을 받고, 버전이 업그레이드되는 과정에서 시각화 API를 사용하기가 더욱 쉬워지기를 희망합니다.
결론
머신 러닝 여정에서 모델을 시각화로 설명하는 것은 그들을 훈련시키는 것만큼 중요합니다.
본문에서는 현재 버전의 scikit-learn에서 다양한 플로팅 API를 소개했습니다.
이러한 API를 사용하면 Matplotlib 코드를 간소화하고 학습 곡선을 완화시키며 모델 평가 프로세스를 간소화할 수 있습니다.
API에 대해 상세히 다루지 않아서 죄송합니다. 자세한 내용을 원하시면 관련 공식 문서를 확인해보세요.
이제 당신 차례입니다. 기계 학습 방법을 시각화하는 데 기대하는 점이 무엇인가요? 의견을 자유롭게 남겨 주세요.
이 글을 즐겼다면, 더 많은 첨단 데이터 과학 팁을 받고 싶다면 지금 구독하세요! 피드백과 질문은 언제나 환영합니다. 아래 댓글에서 토론해요!
이 기사는 원문이 Data Leads Future에 게재되었습니다.